Simrad PI50 Features and functionality
The Simrad PI50 catch monitoring system provides you with an impressive range of operational features and functions. Together they put you in control of the gear.
All information in one view
On the PI50, all information is provided in one view. Set up the system to display the sensor you wish to monitor, and pay no further attention to operation. All information from the sensors are immediately available.

A: Title Bar
The Title Bar identifies the logo, and provides navigational information and key buttons buttons. These are used to hide or retrieve the menu system, and to enable basic system functions.
B: Sensor views
The sensor views are automatically placed on top of each other. They reflect the sensors you have chosen, and the order you have given the sensors when you defined them.
C: Trend views
Each sensor presentation can be expanded into a trend view to show the historic development of the information provided by the sensor.
D: Main menu
The menu system is by default located on the right hand side of the presentation. To open any of the sub-menus, click the icons.
E: Sub-menus
Three sub-menus may be opened from the icons at the bottom of the main menu.
Large and easily readable sensor views
The data from each sensor connected to the PI50 system is easily readable. If you disable the history views and hide the menu system, each information rectangle will fill the entire width of your display screen.
The sensor view from a PI Temperature/Depth sensor is shown here as an example. As this is a dual sensor, it will seize two sensor view rectangles.
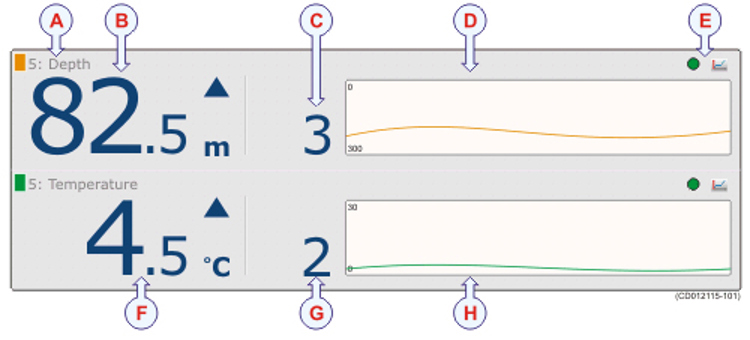
A: Sensor colour code, identifier and name
B: Current depth
This the current depth measured by the sensor. For other sensors, their key information is presented in a similar manner.
C: Depth changes
This digit shows depth changes recorded by the sensor, and thus the ascending or descending speed of the net. For other sensors, similar information is provided when the sensor readouts changes.
D: History field
When the size of the presentation rectangle permits, a history field is shown. The field offers a graphical presentation of the sensor information for the last 20 minutes.
E: Pulse lamp and Trend view icons
The green "Pulse" lamp icon flashes every time a signal is received from the corresponding sensor. The Trend view icon opens (and closes) the Trend view for the corresponding sensor.
F: Current temperature
This the current temperature measured by the sensor.
G: Temperature changes
This digit shows temperature changes recorded by the sensor.
H: History field
Trend views
The Trend views are opened by clicking the icon in the top right corner of each Sensor view rectangle. Each trend view comprises a graph. The graph displays the historic development of the information provided by the sensor.
Once opened, each graph is placed on the left side of the screen. If more than one graph is opened, they are placed on top of each other, in the order you open them. The vertical size of each graph is automatically adjusted. The curve provided by the graph uses the same colour that is used to identify the sensor in the Sensor view.
The trend view for a PI Height is shown as an example.
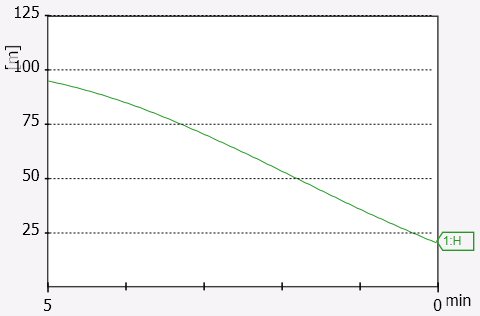
In this example, the PI Height trend view shows the height values recorded by the sensor. The vertical and horizontal scales are easily adjusted, and the history curve has the same colour as used to identify the sensor in the Sensor view.
The small label at the right end of the curve identifies the sensor’s Label ID and the type of sensor.
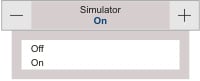
Built-in simulator
The PI50 offers a built-in simulator that will create artificial sensor data. It will create this data to match any sensor configuration.
This feature is useful for system testing and familiarization.