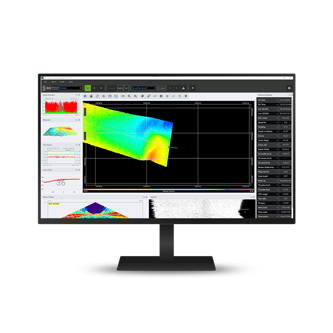
Impedance Measurement Service
Health Check for EM Echo Sounders
The Impedance Measurement Service provides a deeper diagnostic check for KONGSBERG EM echo sounders (EM712, EM304 MKII and EM124), helping ensure optimal performance and data quality. This service complements the Built-In System Test (BIST) by evaluating transducer health and identifying potential degradation.
Why use Impedance Measurement?
While BIST checks software and basic hardware status, impedance measurement analyzes the electrical characteristics of each transducer element. This helps detect issues that may affect sonar performance, such as increased sidelobes or uneven sensitivity.
Key Parameters Assessed
The RX tests look for sensitivity across staves. Uniform sensitivity is ideal, whereas stray staves may indicate degradation.
The RX channels are measured for impedance magnitude and any channels outside the product specification will be identified.
The TX channels are measured for phase angle impedance and any channels outside the product specification will be identified.
How to perform the test
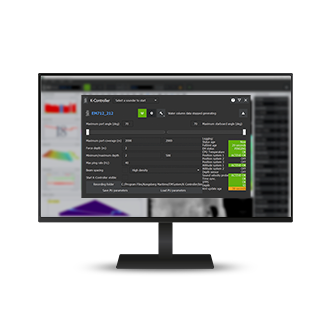
The test is conducted using K-Controller software and requires no specialized equipment. Data can be collected by a KONGSBERG Field Service Engineer or by the customer with remote support.
Benefits of Impedance Measurement
- Detects early signs of transducer degradation
- Improves sonar data quality
- Enables proactive maintenance
- Supports long-term system health tracking
Example Results

Figure 1: Graph of stave data highlighting stray staves

Figure 2: Graph of impedance magnitude across RX channels

Figure 3: Graph displaying the phase data from the TX
The customer will receive a report detailing the findings and drawing comparisons between historical data to identify any patterns or trends in the health of the system.
Key features
- Creates a record of system health throughout the life of your hardware
- Indicates element-level degradation
- Supplements data quality analysis
- Available by request
- Data collection can be done by the customer
- No service trip required
Let's connect!
Stay connected with the latest updates, insights, and stories from our team. We share valuable content on industry trends, news, and behind-the-scenes highlights to keep you informed and inspired.
How can we help?
If you are experiencing any issues or have technical questions regarding your equipment, please don't hesitate to reach out. Our dedicated hydrographic support team is here to assist you with any challenges you may encounter.
Related products
We offer comprehensive after-sales assistance
-
24/7 Technical support
Our Technical Support team is readily available to provide global 24/7 support and can respond to resolve any issues at any time, wherever you are located in the world.
-
Training
We can provide detailed training on the use of our products to ensure your crew is equipped with the necessary operational competence to minimise technical risk and maximise return on your asset investment.
